Daily Time Frame – EUR/USD Reversal Beginning to Falter
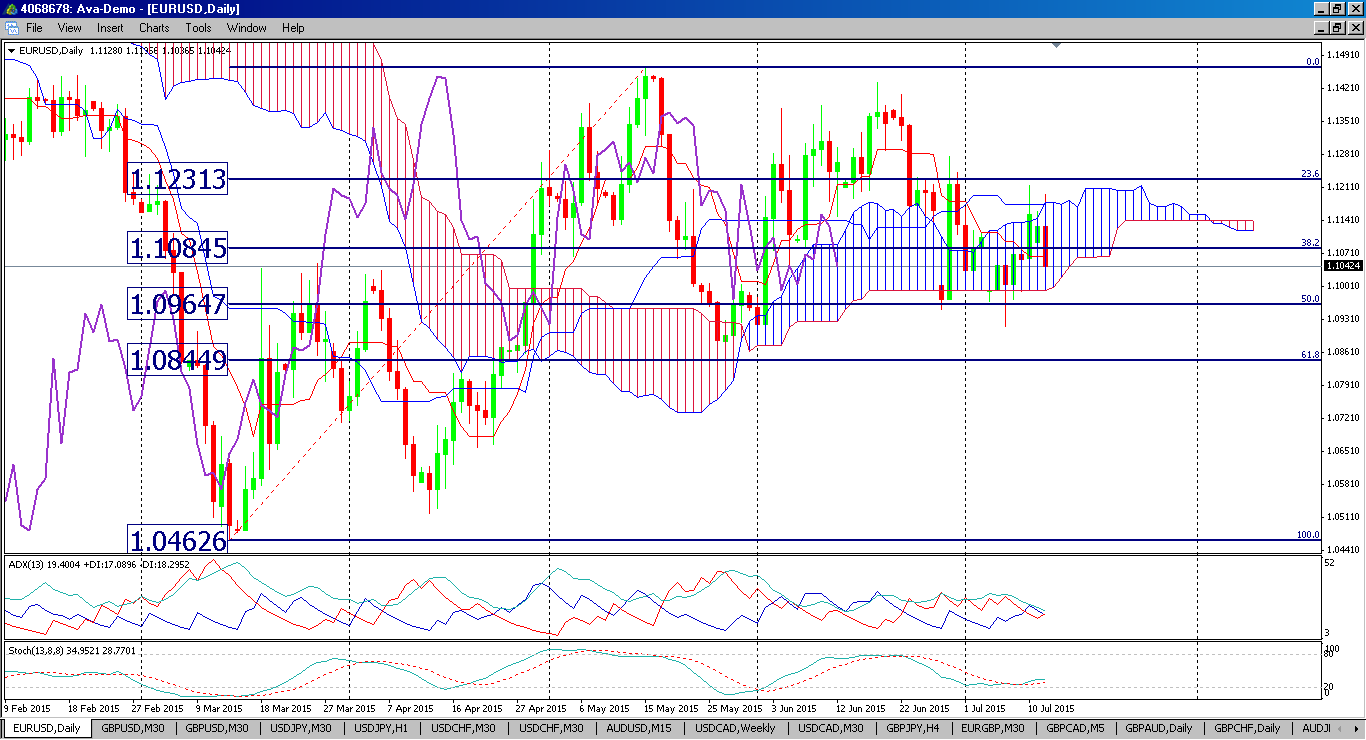
Support: 1.09647, 1.08449, 1.04626
Resistance: 1.10845, 1.12313, 1.14502
Strategy: Enter Long positions when price bounces off 1.09647, Stop Loss 60/70 pips Take Profit as price reaches 1.12313.
Looking at the Day Chart we can see that price action for the past 17 days has been within a range set by the 23.6% and 50% Fibonacci retracement lines between 1.0964 and 1.1231. That is a fairly wide range which is not surprising given the most recent events concerning a possible Grexit.
The Euro reversed its downward trend, after reaching a low of 1.04611, on March 13th giving way to a rally that reached a recent high on May 15th at 1.14501. Drawing the Fibonacci retracement lines between these two points has given the two levels mentioned above which have acted as support and resistance. The Euro would still seem to be in a possible Bull trend, short term, as price action has not been able to break the downside of the Ichimoku cloud. ADX/DMI and Stochastic Oscillator are both showing signs of lack of momentum, coherent with recent range trading activity.
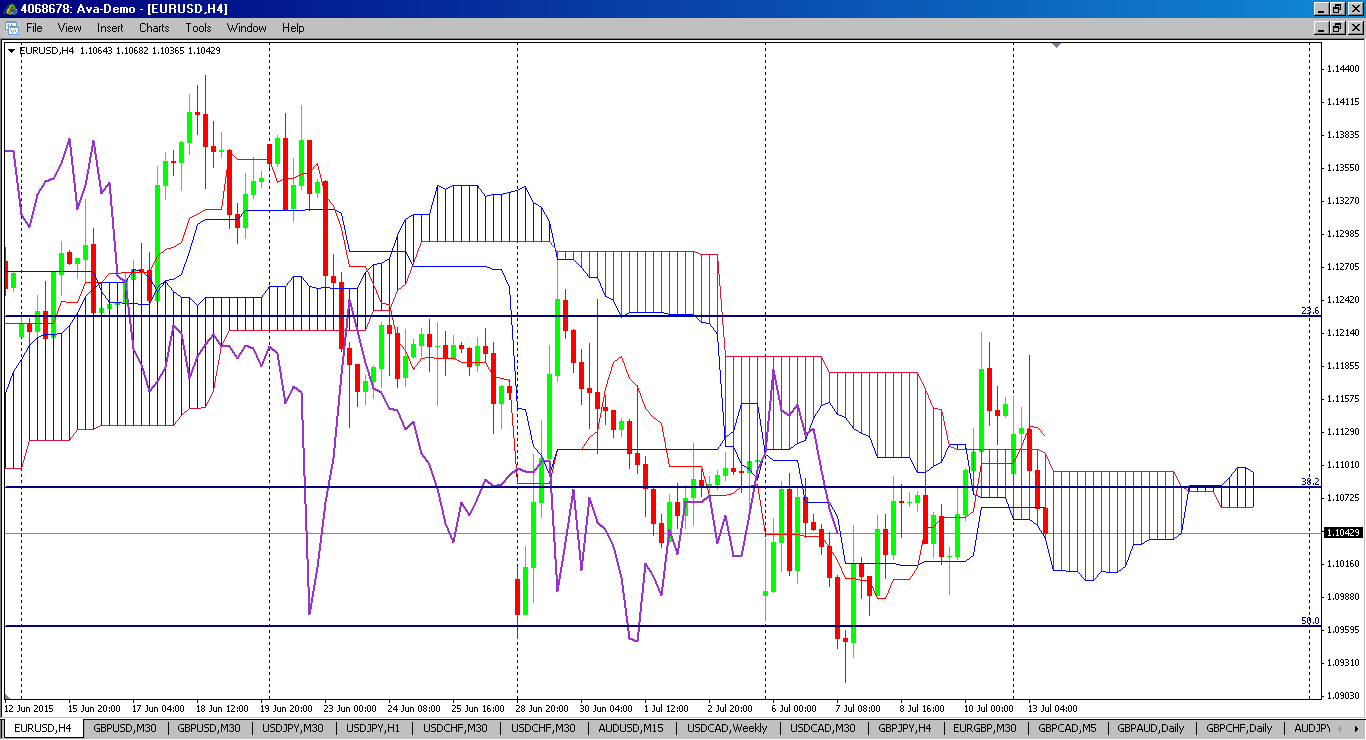
4 HR chart showing signs of weakness
Support: 1.09647, 1.09150, 1.08449
Resistance: 1.10845, 1.12313, 1.14501
Strategy: Enter Long positions between 1.09647 and 1.09150 Stop Loss 30/50 pips Target Profit 1.10845
On the 4HR chart we can see that price broke the bottom side of the Ichimoku cloud and remained below it for most of June through to the beginning of July. An attempt to break the cloud on the upside failed 8 candles back, where price met the resistance of the cloud, the lagging line failed to break the cloud and the resistance of the 23.6% line. This may open up to more downward momentum in the coming days, but we have to see a strong close below the cloud on the Day chart and preferably also below the 50% line, it is also important for the lagging line to confirm the break by closing below the cloud.
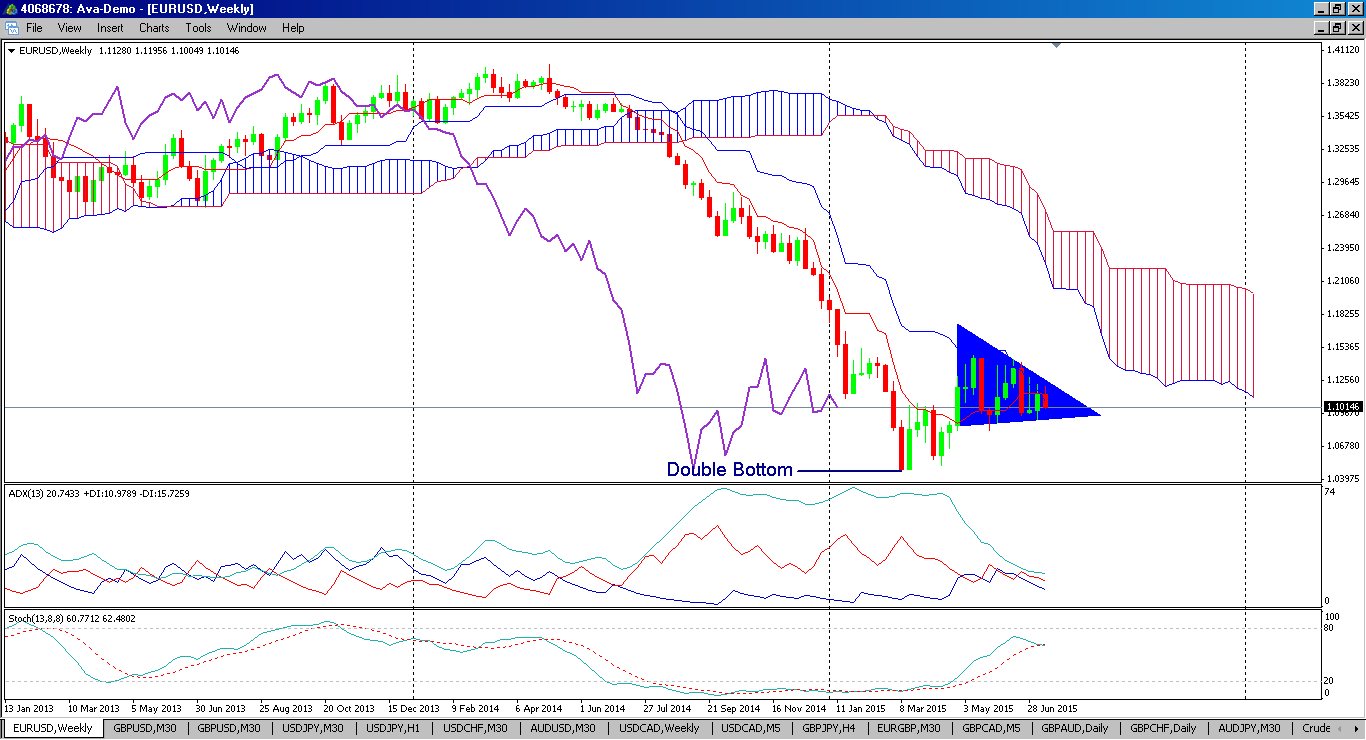
Weekly time frame – Bear Trend may have reversed
Support: 1.08222, 1.05873, 1.04598
Resistance:Â 1.1145, 1.14501, 1.17222
Strategy: Long positions between 1.09500 and 1.10250 Stop Loss below 1.0773 Target Profit below 1.17222
The medium term trend still remains a Bear trend considering the weaker GDP growth rate, low interest rate environment and generally sluggish European economy. Looking at the weekly chart this trend seems quite evident; however we may have run into a double bottom as indicated in the chart, price action from that 2 candle pattern has shown higher prices and also given rise to what may be a continuation triangle. A break on either side of this triangle should show the next direction over several weeks. The Stochastic Oscillator is showing upward momentum, although the fast line is closing in on the slow line, so it remains to be seen if there is a cross over indicating a possible return to downward momentum. The ADX/DMI on the weekly chart is also showing lack of momentum or sideways price action.
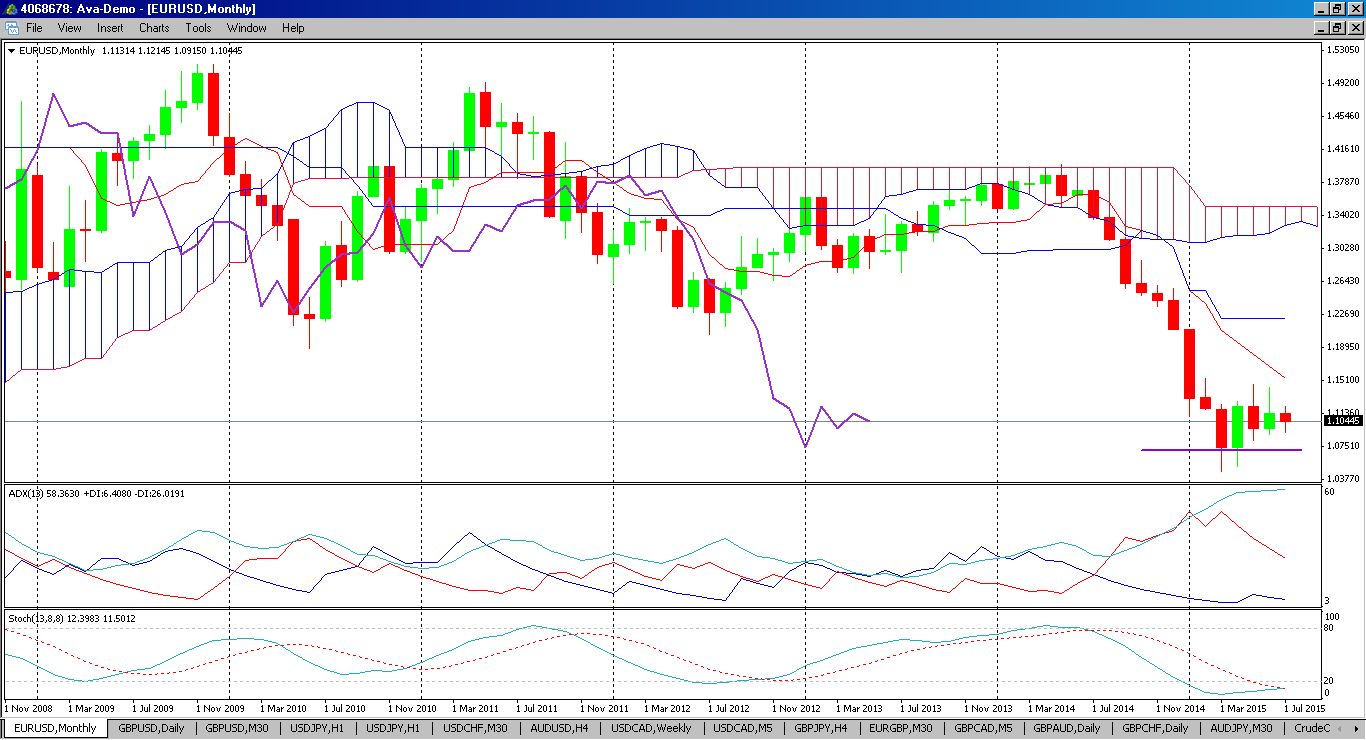
Monthly time frame – Consolidation in an oversold area
Support: 1.08178, 1.04626, 0.99220
Resistance: 1.14501, 1.17222, 1.22267
Strategy: Long positions below 1.09500 Stop loss below 1.04626 Target Profit below 1.22267
The monthly chart shows a big consolidation area happing over the past 4 months. Price action also formed a double bottom on the purple line over the months of March and April. The ADX and Stochastic Oscillator are both showing signs of oversold territory, ADX above 60 on a Monthly chart is extremely high, the SO is crossing over to upward momentum from below twenty, both indicate strong chances of a move upwards.
I see the short term upward trend continuing once a solution is reached with Greece, resistance area will be its most recent high at 1.14502 which will also coincide with the bottom of the Ichimoku cloud on the Weekly chart, the next resistance should that not hold I see at 1.1826, that should take us through the summer after which the downward trend for the Euro should continue as a US rate hike will begin to be closer to materializing.


